syllabus
- investigate how the operation of the water cycle connects people and places, for example:
- identification of water cycle processes
- explanation of water flows within a catchment area
- examination of factors influencing water flows and the availability of water resources in different places eg latitude, altitude, topography, location, climate change
- identification of water cycle processes
|
|
|
The Natural Water Cycle
The natural water cycle is a process that uses physical actions to keep water moving between the Earth's surface and the atmosphere. This cycle is also known as the hydrological cycle.
The natural water cycle is a process that uses physical actions to keep water moving between the Earth's surface and the atmosphere. This cycle is also known as the hydrological cycle.
- Evaporation: This occurs when the sun's heat causes water to turn into a gas called water vapour, which then rises into the air.
- Transpiration: When the sun warms up people, plants, and animals, they release water vapour into the air.
- Condensation: Water vapour in the air cools down and changes back into a liquid form, creating small water droplets in the sky.
- Precipitation: Water droplets fall from the sky in the form of rain, snow, or hail.
- Run-off: Water flows over the ground and into creeks, rivers, and oceans.
- Infiltration: Water falls on the ground and soaks into the soil.
- Percolation: Water seeps deeper into tiny spaces within the soil and rock.
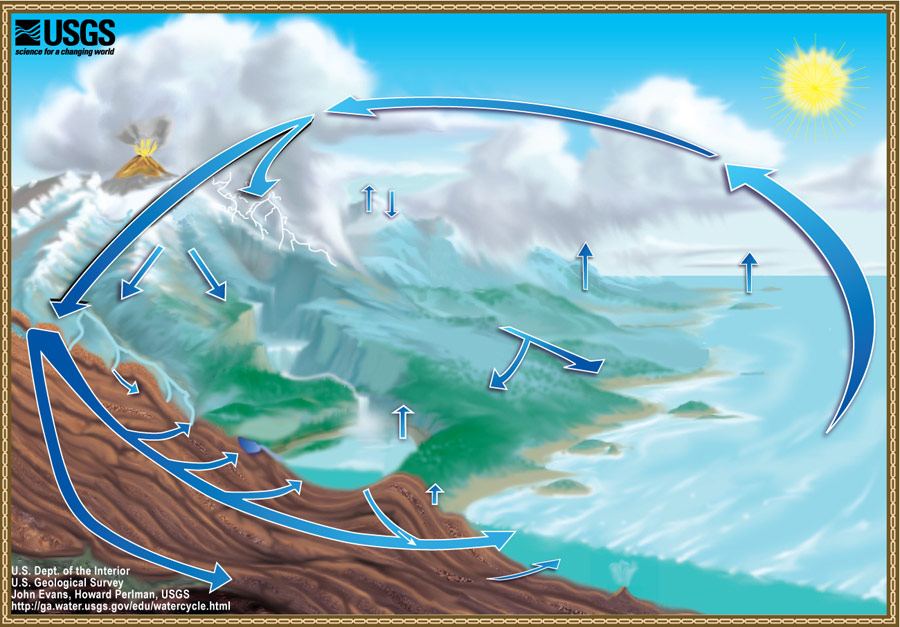
In pencil, to the best of your ability, draw the above diagram and label with the aspects of the water cycle that you already know.

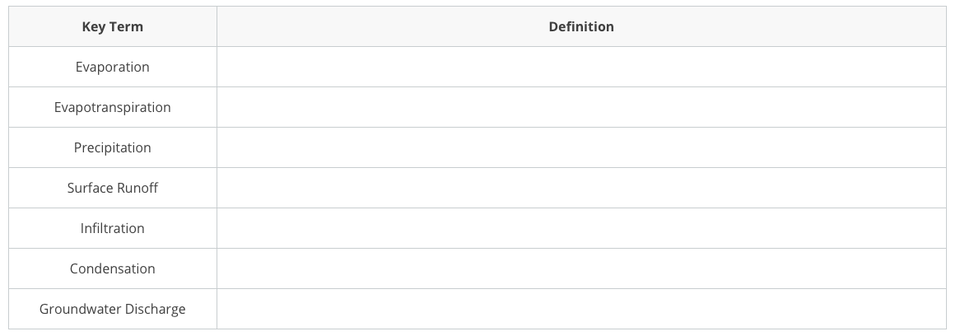
Copy the table below into your workbook. Write the definition for each term in the right hand column. Look up any terms you do not know the meaning of. Some of the text above may help you.
factors affecting the water cycle
Understanding the Impact of Human Activities on the Water Cycle
The water cycle, a vital natural process known as the hydrological cycle, can be significantly influenced by human activities. Urbanisation, the development of cities and infrastructure, alters the natural landscape and disrupts the flow of water into the ground and rivers, affecting how the water cycle operates. Additionally, deforestation, the cutting down of trees, hinders the release of water vapor into the air, crucial for the formation of rain. These changes in land use can impact how water is absorbed into the soil and flows, thus modifying the water cycle's delicate balance.
Environmental Challenges and the Water Cycle
Climate change, a pressing global issue, poses a significant threat to the water cycle. Changes in temperature and weather patterns can disrupt the natural processes of evaporation, condensation, and precipitation, altering the movement of water between the Earth's surface and the atmosphere. Moreover, pollution in water bodies can lead to detrimental effects on both natural ecosystems and human water resources, impacting the quality of water in the cycle. Understanding these environmental challenges and their implications for the water cycle is crucial for promoting sustainable water management practices and protecting the integrity of this essential natural process.
TASK
|
Critical Thinking Question:
How do you think the increasing urbanisation and deforestation in your local area might be affecting the water cycle and overall ecosystem? Write a paragraph discussing your thoughts on the potential impacts of human activities on the environment and the importance of preserving the natural balance of the water cycle. (60 words) |
|
Factors that affect the Water Cycle:
👈Complete the mix and match activity in the Google Doc |
| water_sheet_6feb.docx |
Complete the above worksheet individually.
Weather Vs. Climate - What's the Difference?
|
Weather:
is day-to-day, short term change in the atmosphere at a particular location. Extreme weather events are often described as unexpected, rare, or not fitting the usual pattern experienced at a location. |
Climate:
is the average weather conditions that are measured over a long time. Places that share the same type of weather are said to lie in the same climatic zone. |
This morning we are going to aim to complete three tasks:
- Go to P. 245 of your GeoActive 1 textbook. Copy Figure 2 in to your book labelling the different spheres that surround the Earth.
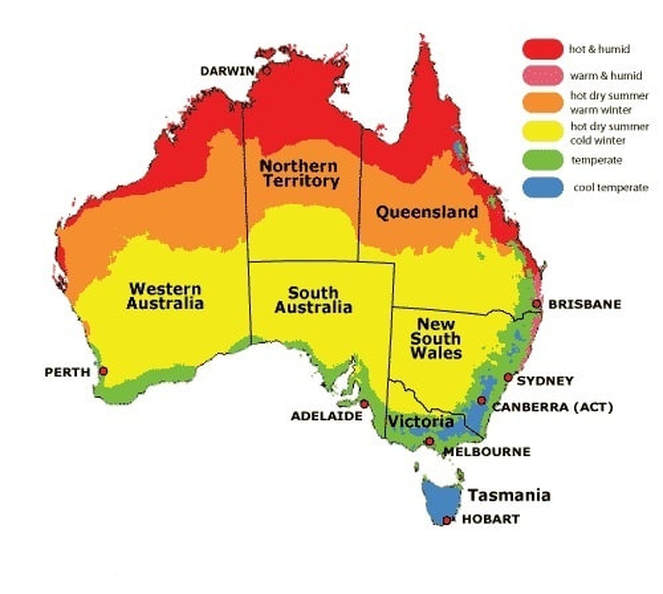
- On the blank map of Australia, Recreate Figure 3 (Climatic zones of Australia - P. 246). Make sure you use different colours and include the key below your map.
- Read through P. 245-6 and answer the questions on P. 247 in your books.
Now, we are going to compare the climatic zones to our major drainage basins. Turn to P. 278 where you will find Figure 2 and Table 1. Firstly, you are to turn this data in a graph in your books with clear labels and titles. Then, I want you to read through P. 279-81 and answer the Activity Question in your books.
Graphing - 'How To' Guide
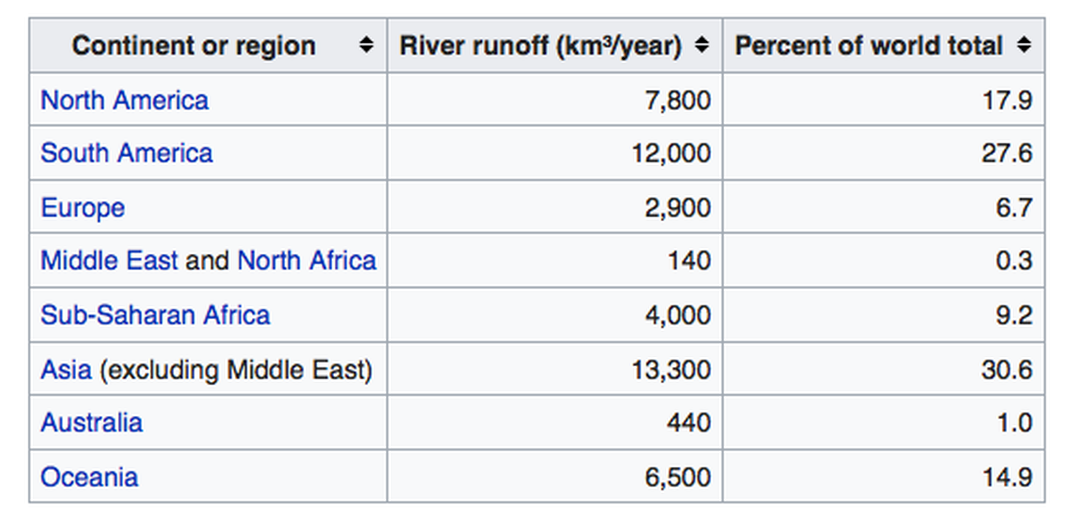
Firstly, we are going to start simple. Below, there is a table with the total river runoff per continent. This is the amount of water running off the land into the ocean for each continuent in the world. I want you to turn these figures in to a beautiful graph. You are going to create a Column Graph. Make sure you label your graph appropriately. I will check your progress as we go.
What should be on your finished graph?
When drawing a graph, students should adhere to the following basic graphing conventions:
- Title: Every graph should have a descriptive title that clearly indicates what the graph represents.
- Axes Labels: The x-axis and y-axis should be labeled with the quantity being measured on each axis. Include units of measurement where applicable.
- Scale: The scale on each axis should be consistent and evenly spaced to accurately represent the data being plotted.
- Data Points: Plot data points accurately on the graph using symbols such as dots or crosses. Make sure each data point is clearly visible and distinguishable.
- Lines/Bar: Connect data points with a line or use bars to represent the data, depending on the type of graph being used.
- Key/Legend: If different data sets or categories are being represented on the graph, include a key or legend to clarify which data series each color or symbol represents.
The total volume of water in rivers is estimated at 2,120 km³ (510 cubic miles), or 2% of the surface fresh water on Earth. Rivers and basins are often compared not according to their static volume, but to their flow of water, or surface runoff. The distribution of river runoff across the Earth's surface is very uneven.
To make the graph, download Google Sheets to your iPads. You are to recreate the figures above in to a table using Google Sheets. Try to create a few graphs and see the range that Google Sheets offers. Watch the video below to see how to make the table and then the graph.
Homework - Answer the question below and submit it to our Google Classroom. This only needs to be a three sentence response.
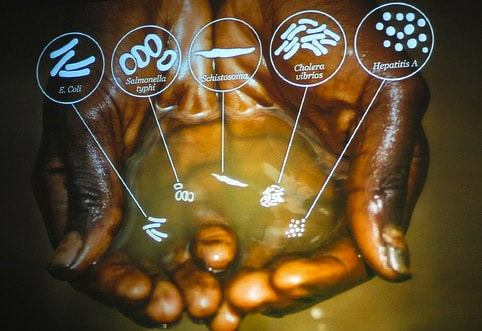
Why is it important to keep our
catchments clean?