CAUSES AND CONSEQUENCES OF URBANISATION
Syllabus
- investigate the causes and consequences of urbanisation with reference to ONE Asian country, for example
|
|

The teacher will show this as a whole class. Full screen will work best by clicking the 3 dots at the bottom. Complete the questions in the file below as you work your way through the PowerPoint.
| ||
Where is urbanisation taking place in the world?
|
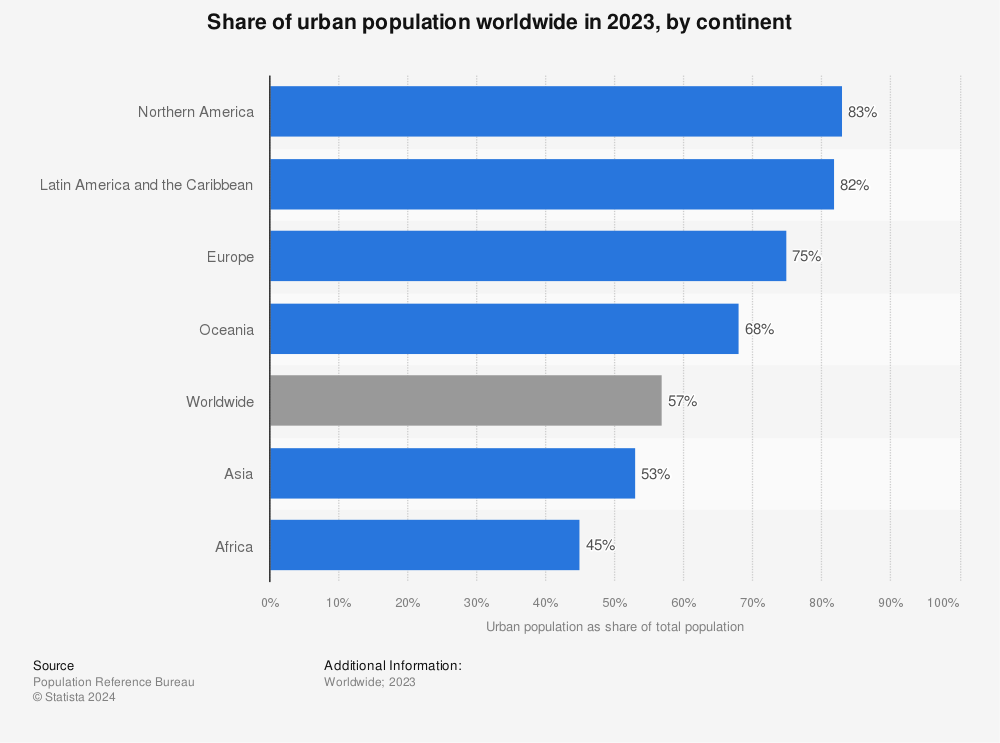
The image above shows the number of people living in urban regions around the world.
|
|
The map above shows us that urban places are NOT evenly distributed around the world. North America, Europe, and Asia have the highest concentration of urban places. This is due to historical, economic, and social factors, as well as larger populations and developed infrastructure. For example, many cities in North America and Europe grew during the industrial revolution, while Asian cities are growing rapidly due to economic development and urbanisation. Understanding the distribution of urban places helps us understand the causes and consequences of urbanisation in different regions.
|
|
View the slideshow to the left with your teacher (place in Google Classroom). Complete the google doc sheet below during the presenation.
|

URBANISATION OF A SELECTED CITY
|
Choose a city in the world. You may choose any city you like but Australian cities will be easier to research on most occasions. The population of your chosen city MUST be more than 15,000 people. Your chosen city can be from the developed or the developing world.
|
|
|
Find out the following information about your chosen city using Wikipedia. 👉
|
Construct a presentation or report on your chosen city which reports on the following:
In your report you can provide graphs, maps, graphic organisers and images to support your work.
Hand your completed presentation into Google Classroom.
- The name of the city and the country it’s located in.
- Include a satellite image from google maps in your report of your chosen city including all of the outer boundaries of the city area known as the Greater Metropolitan Area.
- The population of the city including the greater metropolitan area
- The rate of urban growth in the city
- Provide evidence of a recently completed development in the city. You can show this by including pictures in your report. Add some information about the development and provide a source of the picture URL.
- Provide a snapshot of the climate of the city.
- Provide some details of cultural life in the city. For example, music festivals, Sporting events or venues, theme parks etc.
- Provide evidence of connectivity to other cities. This may include international airports, large railway stations, expressways and ports. You will need to prove that they connect people to other cities.
- Show physical characteristics of the city through the use of photographs and maps. This may include mountains in and around the city, water bodies such as estuaries and rivers and wetlands if evident.
In your report you can provide graphs, maps, graphic organisers and images to support your work.
Hand your completed presentation into Google Classroom.
Cities around the world
|
Lion City Rising from Keith Loutit on Vimeo. Source 1. Lion City Rising.
|
Watch changes in Singapore as cities develop and change in an ever speedy dimension. Watch how the human and natural environments work together to create this spectacular modern city.
Can you guess what city you are seeing?
|
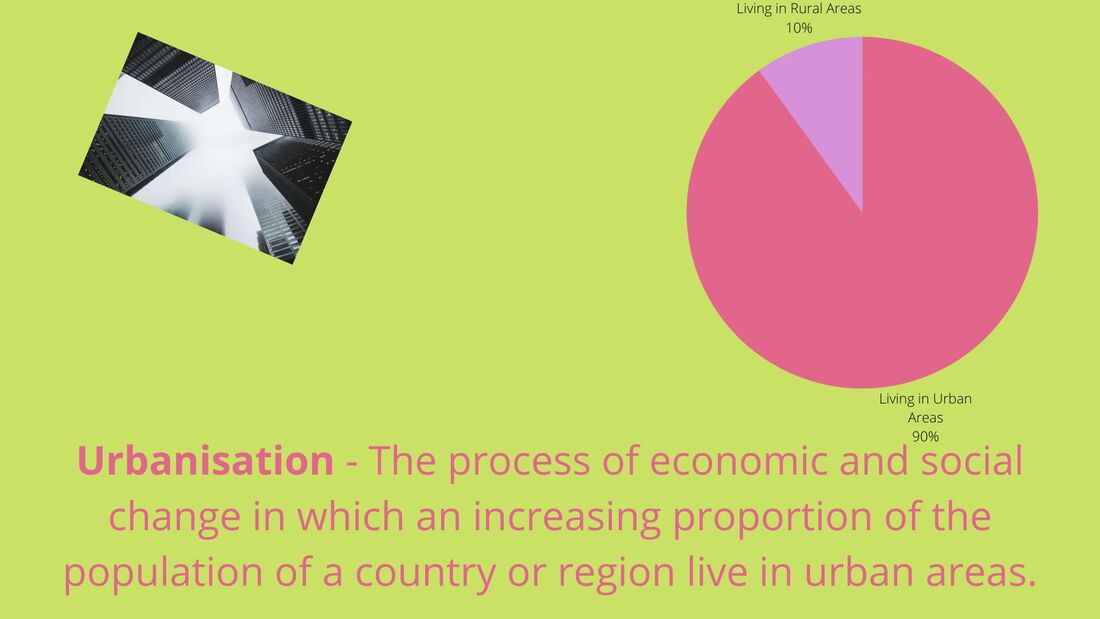
What is urbanisation?Urbanisation is the process of migration from rural to urban areas, resulting in the growth of cities and towns. Urbanisation is characterized by the concentration of people and economic activities in cities, as well as the development of urban infrastructure and services such as transportation, housing, healthcare, and education. Urbanisation is also associated with changes in the social and cultural fabric of communities, as well as changes in the natural environment, including the conversion of rural land to urban land use and the creation of urban ecosystems.

|
|
|
Source 2: Urbanisation of Cities.
Source 3: Growing Cities is Good.
|
Refer to Source 2.
Refer to Source 3.
|
Every week, 1.5 million people are moving into cities across the globe. (World Economic Forum) #Urbanization #ClimateChange #Environment pic.twitter.com/RAkXs4JNYe
— James Gingerich, @Expeflow #WorkEasier #RPA (@jamesvgingerich) May 1, 2022
An Example of a social media video from Twitter.
Watch the following video and answer the questions.
|
Watch source 4 and respond to the following questions.
|
Source 4: Historical Factors shaping city design and function.
|
|
Extension
- Watch Source 5 and answer the following questions. Complete Q1 before starting the video.
|
Source 5: The future of Megacities.
|
Causes of Urbanisation
|
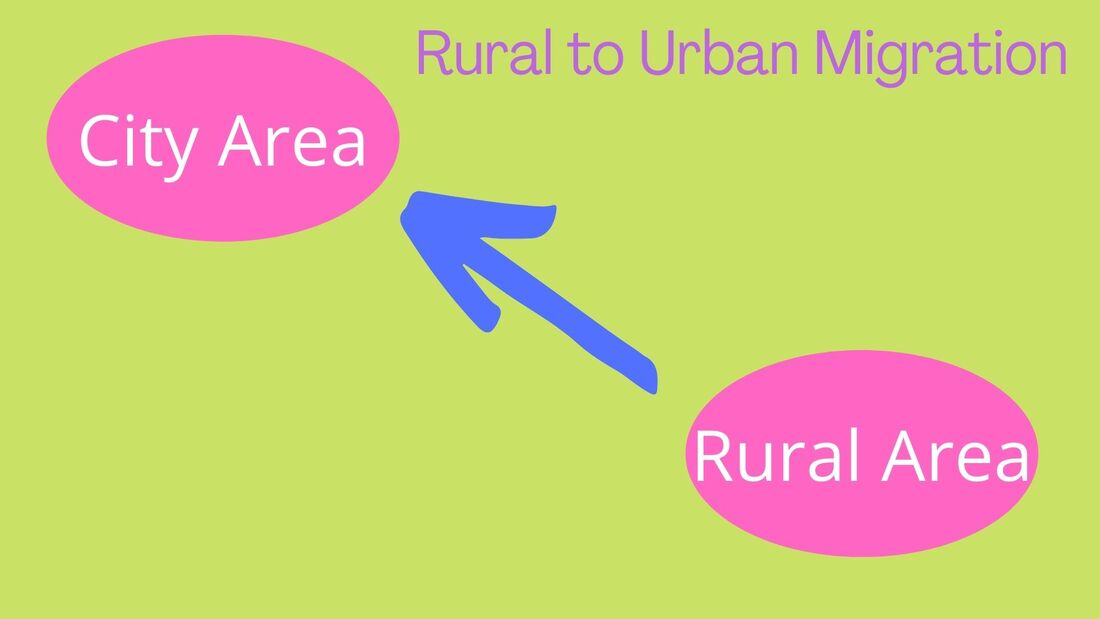
Urbanisation means an increase in the proportion of people living in urban areas compared to rural areas. An urban area is a built-up area such as a town or city. A rural area is an area of countryside.
As a country industrialises, the number of people living in urban areas tends to increase. Australia and many other MEDCs (More Economically Developed Countries) urbanised during the 18th, 19th and 20th centuries. People migrated from rural areas (due to the mechanisation in farming) to urban areas where there was employment in the new factories. The area of cities known as the inner city developed during this time as rows of terraced housing were built for workers. Today most people live in urban societies, with 90 per cent of the population living in towns or cities. On a global scale, urbanisation is taking place rapidly, particularly in LEDCs (Less Economically Developed Countries) where the rate is highest. This is because most LEDCs have only recently become industrialised. China and India are two obvious examples of this Industrialisation. Other causes include:
|
TASKS:
|
urbanisation in LEDC's
|
|
Click the video and sign in with your school email. Then follow the prompts. Complete question 1. (below) before watching the video.
Defining Key Terms Fertility Rate - The number of babies born per women. Infant Mortality Rate - the number of babies that die before 5 years of age. Caste - An Indian system that ranks the importance and status of families. |
Questions
- Define the above terms in green.
- Describe the causes of Urbanisation.
- Provide three examples of how an Australian city supports your response to question 1. For example, what evidence exists that Sydney has industrialised, modernised and provided a better standard of living than where you live? Use evidence to support your statement. For example, identify how many universities (education) are in Sydney compared to Bega.
- What does a better quality of living look like, feel like and sound like?
- Explain why people in India are moving to the city.
- What types of opportunities are available in India's cities?
Consequences of Urbanisation
|
Download and open the document below this text. Then watch the video, 'Effects of Urbanisation' and fill in the fact sheet as you watch the video.
|
| ||
More people live in urban and rural settlements due to natural increase - when the birth rate is higher than death rate - and the movement of people from rural to urban places. The causes and consequences of urbanisation will be examined in this course, drawing on examples from Asia where urbanisation is occurring rapidly. Wealth is generated in cities, making urbanisation a key to economic development. However, urbanisation has caused air and water pollution, land degradation and loss of biodiversity. It has forced millions of people to live in slums without clean water, sanitation and electricity.
In the future, rising sea levels and an increased incidence of weather disasters will impact adversely on low-lying coastal cities. Creating sustainable urban places is a challenge at a national and global scale. Strategies to enhance the sustainability and liveability of Asian cities include examples from Singapore and Seoul.
In the future, rising sea levels and an increased incidence of weather disasters will impact adversely on low-lying coastal cities. Creating sustainable urban places is a challenge at a national and global scale. Strategies to enhance the sustainability and liveability of Asian cities include examples from Singapore and Seoul.
|
Option 1: More complex
|
Option 2: Less complex
|
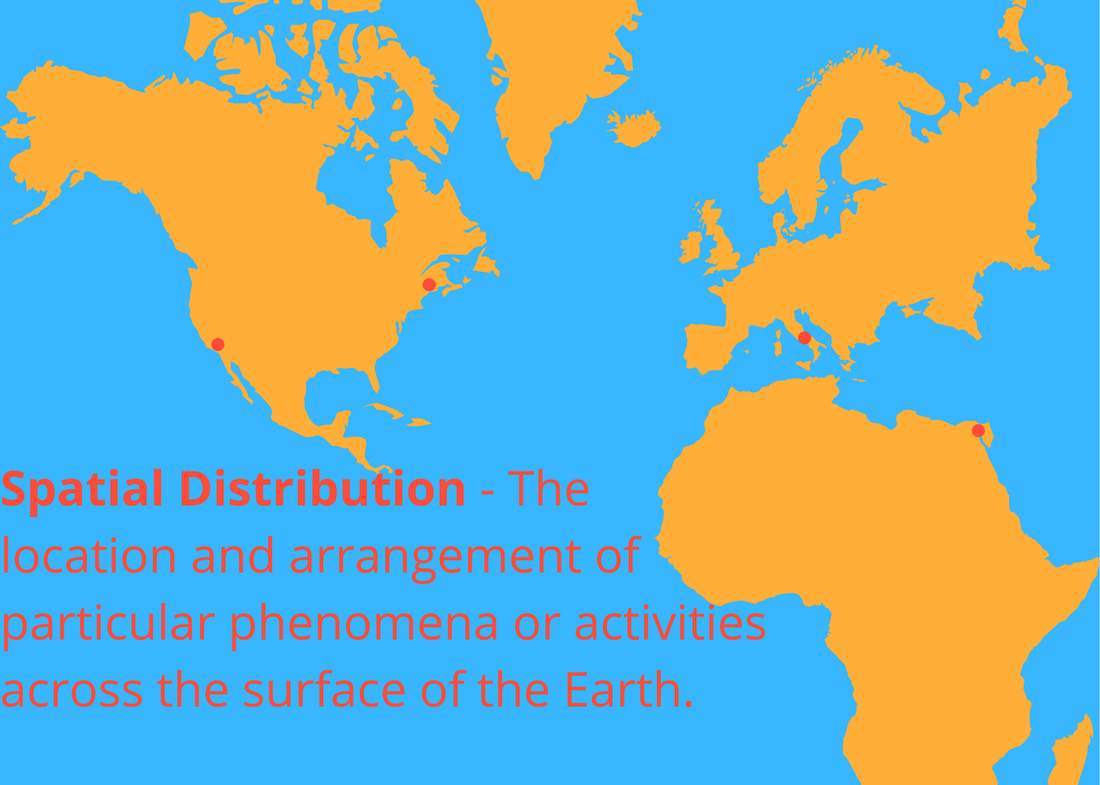
Urbanisation on a Global Scale
|
Geographers attempt to identify the spatial distribution of urbanisation taking place around the world. We often use maps to show the location of where urbanisation is taking place.
Question
|
America
— Spriteer (@spriteer_774400) July 27, 2022
This is what the road looks like from Portland Airport, Oregon's largest city. Local authorities carefully made bike paths and now homeless people and drug addicts live on them in their trailers and cars. pic.twitter.com/kquEW7ZrsH
|
|
|
|
Source: Our World In Data
|
Source: Our World in Data
|
TASKS:
- Refer to the chart above. Go full screen and hit the play button. How do Urban and Rural populations change over time? Use data in your response.
- Predict the likely changes to urban and rural populations in the future base on past patterns.
- Refer to the map above. Go full screen and hit the play button. Australia has been urbanised since 1960. Why might this be the case?
- Which continent has had the least urbanisation in the world?
|
|
TASKS:
|
Urbanisation in China
|
Questions
|
|
Population Density in China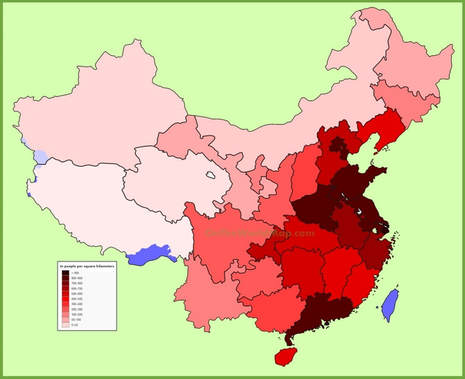
|
Population Density in Australia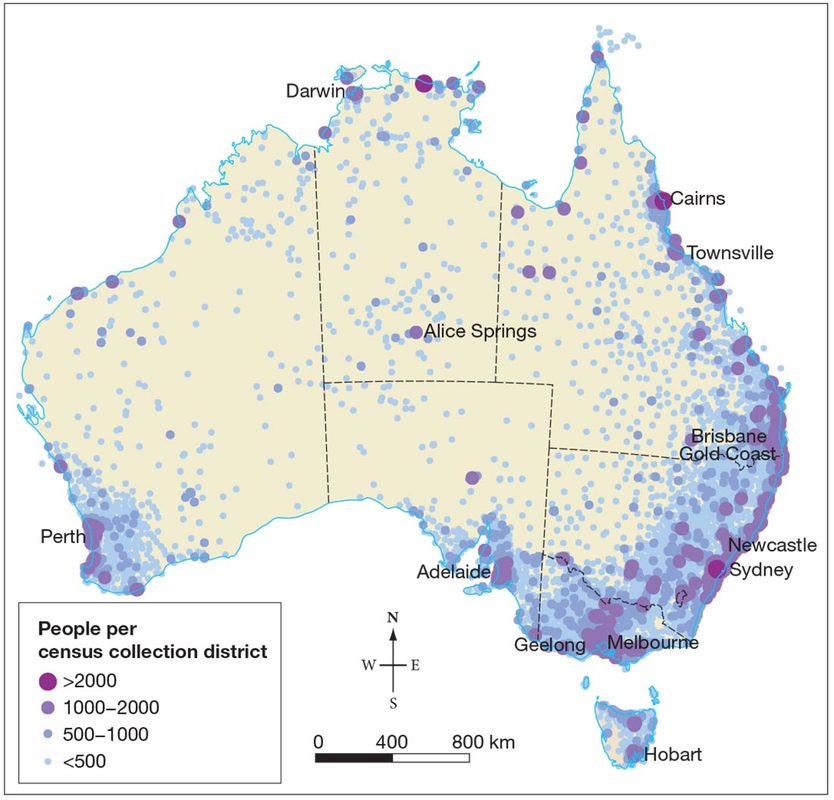
|
Short Answer Question
Write a 4 paragraph response that answers the following question. 'How is China's population density similar and different to that of Australia's? 1 paragraph for an Introduction, 1 for similarities, 1 for differences and 1 for your conclusion. Use place names, direction and distance in your response
Homework
Read pages 179-181
Answer questions 1-4 in your exercise book
Answer questions 1-4 in your exercise book
Population Pyramids
|
Population pyramids are used by demographers as a tool for understanding the make-up of a given population, whether a city, country, region, or the world. Learning about, using, and understanding these pyramids is an important part of Human Geography. So what is a Population Pyramid?
A Population Pyramid is a graph that shows the age-sex distribution of a given population. It a graphic profile of the population’s residents. Gender is shown on the left/right sides, age on the y-axis, and the percentage of population on the x-axis. Each grouping (ex: males aged 0-4) is called a cohort. A population pyramid does not tell us the actual population in numbers. Rather, it displays percentages and shows what proportion of people fall into each cohort. Demographers use population pyramids to see population trends in the past, examine the current resident profile, and also to project how the population will increase/decrease in the future. |
|
Questions
- Describe what is meant by Rapid, Slow and Negative growth in your books.
- Sketch what these Pyramids typically look like.
- Research Australia's current Population Pyramid - which category do we fit into?
World Population History
Watch the following Clip. Take notes on when there are significant changes to population.
